


The reverse DCF is a tool that I have recently had the opportunity to add to my repertoire. In this piece, I will go over the concept and apply it to Netflix, a company that has been placed on a pedestal as one of the trailblazers in the online streaming industry and a top-tier technology company.
____________________Pre-requisite knowledge: The Discounted Cash Flow model, knowledge of geometric progressions
As the name implies, the ‘reverse DCF’ is an inverse of the standard Discounted Cash Flow model valuation technique. In a paper “IPO Pricing: Growth Rates Implied in Offer Prices.”, its authors use the reverse DCF methodology to study the valuation of companies going public and defines a methodology to infer the growth expectations implicit in their IPO prices. It turns out that this can be applied to any arbitrary equity you can think of as long as you have their fundamental financial data. To phrase it in the same manner, you can use the model to infer the growth expectations implicit in any share price.
Method
The methodology is straightforward once you see it but requires practice for familiarity. As a rule of thumb, don’t use or buy things that you don’t understand; make your own models and avoid using free templates without understanding what the calculations are first.
The components required are the TTM free cash flow, the weighted average cost of capital (WACC), a terminal growth rate and company present cash and debt values.
Let us take stock X with:
Current price = $10
Free cash flow = $10
5 shares outstanding
Debt = $1
Cash = $2
We start with a trial value for the free cash flow compound growth rate for every year, say 10%. Now, we are going to assume that free cash flow grows at that rate every year for five years, after which growth slows, the product becomes commoditized and the company’s growth becomes tagged to inflation or a similar value, say 2%, into infinity (Gordon Growth model). This final growth rate after abnormal growth has ended is the terminal growth rate. We want to know the effective value of all the company’s accumulated worth over that period and must discount the terminal value to the present, which we need the discount rate for. Let us set that at 5%.
So, we have a free cash flow value of ~$16.11 in year 5, which we take the terminal value of by and discount it back to the present . After adding cash and subtracting debt we can divide by the total number of shares to give us the intrinsic value, $97.93. That seems a bit high, so we can calibrate our trial growth rate (now 10%) to a smaller value until our intrinsic value matches the current share price. This is easily done using Excel functions.
The final growth rate is -34.5%. If you want to be more granular, you may use more years and different growth values, but for the sake of simplicity we will only do 5 years of the same growth.
Utility of the Model and Netflix
The utility of this technique lies in being able to ‘arbitrage’ equities based on the market’s expectations and your own. To use an example closer to home, arbitrage is when a scalper on Amazon buys a few hundred sets of the newly released PS5 in bulk at a discount and sells it on the platform at a mark-up to profit from the difference. Selling marked up game consoles is a practice that is sometimes frowned upon but if there is a demand, there will be sellers. In this case, if a stock is trading at a discount in accordance with the model, I can buy it with confidence that its price will rise and I will eventually be selling it off at a profit.
Finally, we move on to my results for NFLX. Innovator, a trailblazer in its own industry, tech stock, FAANG company. Surely, you can’t go wrong buying Netflix Inc. stock. Right? Well, according to the reverse DCF, not necessarily. We see from the sensitivity tables below that the market as of 14 November 2020 has priced in a 16.98% FCF growth rate for the next 5 years.
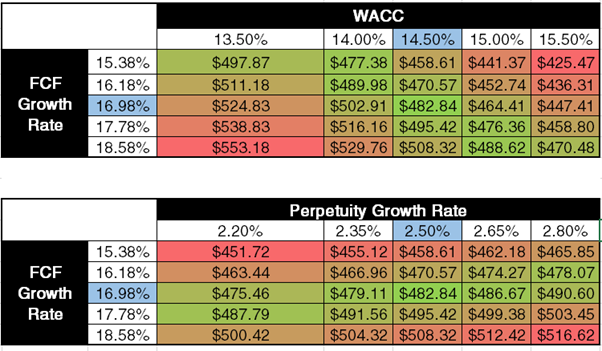
Let’s compare that to Netflix’s growth as projected by analysts based on Yahoo. Out of laziness, we will tag revenue to FCF directly for this article.

Turns out, looking at the trend, it is close to our projected FCF growth rate, easily falling in the range of 15.38% to 18.58%. What does this mean? If we were to take the word of the analysts, and assuming the revenue is tagged to FCF, that would imply there is no value in buying or selling NFLX i.e. NFLX is at a completely fair price accounting for all publicly available information.
Of course, all those assumptions are a stretch and more research would have been required for FCF drivers, but is it completely unexpected if it were true? Not exactly, given how high the volume of Netflix stock trading is and the number of quants and bankers that observe the stock, it actually has a high chance of being near fair value as any value to be had is quickly removed by smart observers.
That wraps up this article on reverse DCF, and I hope you found it insightful.